What's Inside a Solar Panel?
Explore the layers, materials, and manufacturing costs of a solar PV module. Adjust prices below to see how each input affects the final module cost.
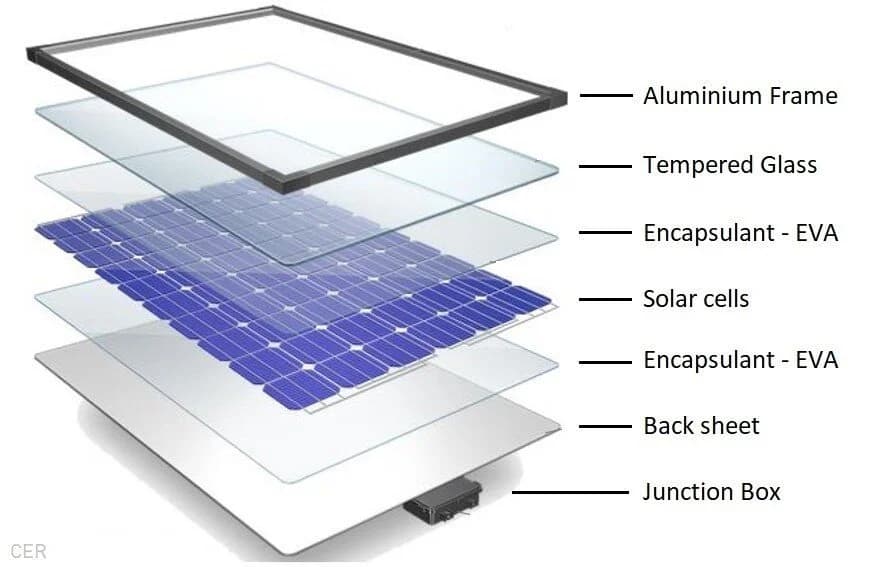
Click any layer on the exploded view image to see its material composition, cost contribution, and supply chain details.
Supply Chain: From Sand to Solar Panel
High-purity silica sand (SiO₂) mined from quarries
Sand is refined to 99.9999% pure silicon using the Siemens process at 1100°C. Consumes 40 kWh/kg of electricity.
Major producers: China (80%), Germany, USA
Polysilicon is melted and grown into a single-crystal ingot (Czochralski method), then sliced into 130μm-thin wafers using diamond wire saws.
Kerf loss (sawing waste): ~30% of silicon is lost as dust
Wafers are doped with phosphorus and boron to create a p-n junction. Silver paste is screen-printed for contacts. Anti-reflective coating (SiNx) is applied.
Silver is the #1 cost swing material at $853/kg
Cells are soldered with copper ribbons, laminated between EVA and glass, framed with aluminum, and fitted with junction box and cables.
Largest stage by cost — dominated by glass, aluminum, and EVA
High-purity silica sand (SiO₂) mined from quarries
Sand is refined to 99.9999% pure silicon using the Siemens process at 1100°C. Consumes 40 kWh/kg of electricity.
Polysilicon is melted and grown into a single-crystal ingot (Czochralski method), then sliced into 130μm-thin wafers using diamond wire saws.
Wafers are doped with phosphorus and boron to create a p-n junction. Silver paste is screen-printed for contacts. Anti-reflective coating (SiNx) is applied.
Cells are soldered with copper ribbons, laminated between EVA and glass, framed with aluminum, and fitted with junction box and cables.
Module Cost Calculator
Drag the sliders to adjust material prices, electricity cost, labour, and margins. Watch how each change ripples through the supply chain to affect the final module price. Based on IRENA's Solar PV Supply Chain Cost Tool (2026).